Data Exploration
The original dataset used for analysis is The Pushshift Reddit Dataset. Our given data is from January 2021 to August 2022.
About the Raw Reddit Dataset
The format of the dataset is parquet and made up of two components: "submissions" and "comments". The submissions file contains 643,255,528 rows and 68 columns, and the comment file contains 4,473,556,762 rows and 21 columns.
The column that we looked into first was the 'subreddit' column. A subreddit is a smaller community in social media Reddit that contains posts associated with the topic. It is the starting point for our Data Selection.
There are some columns that we potentially will use in our project, including numerical columns such as "num_comments"(Submission), "score"(Comment), text columns such as "title"(Submission), "selftext"(Submission), "body"(Comment), and boolean columns such as "over_18", "disable_comments".
Subreddit Selection
We decide to replicate the data collection process from this paper. We select our data from the 12 subreddits in TABLE 1. The "RU Conflict" category directly focuses on the Russia-Ukraine conflict, hence we use all the data from these subreddits. The "Military Related" category contains general discussion on war and military-related topics. To make all the submissions and comments relevant to our topic, we further filter the content and title columns of the "Military Related" subreddits to ensure they contain keywords like ukraine, russia, Putin, etc.
| Category | Subreddit Name |
|---|---|
| RU Conflict | ukraine, ukraina, UkraineConflict, RussiaUkraineWar2022, UkrainianConflict, UkraineWarReports, UkraineInvasionVideos, UkraineWarVideoReport |
| Military Related | war, CombatFootage, CredibleDefense, geopolitics |
TABLE 1: Selected subreddits
Data Engineering
Our source data from the above subreddits is built in this notebook.
Because our selected reddit posts about the Russia-Ukraine conflict can contain multiple languages, we used John Snow's language detection model, detect_language_375, to create "English", "Russian", and "Ukrainian" language percentage columns on the submission data. Notebook is for creating the three language columns.
We also used Regex to find Market and Energy related reddit posts in different languages, using this notebook.
Exploratory Analysis
FIGURE 1 counts the number of unique submission IDs in the selected subreddits. The resulting subset from the original dataset indicates that the submissions are more active after the Russia-Ukraine conflict became a global issue. This corroborates that we are collecting the right data.
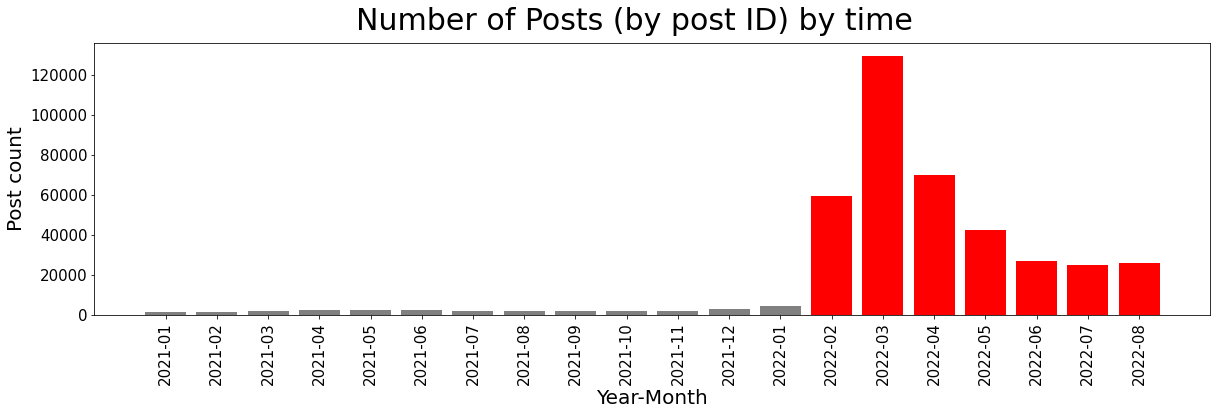
FIGURE 1:Starting from February 2022, number of posts in the dataset increased drastically when the Russia-Ukraine conflict became a global issue.Visualization Code
Our initial steps of EDA are to check data size, missing values, etc. TABLE 2 gives an overview about the basic information of the filtered reddit data and our collected external commodity price data.
| Stats | Reddit Submissions | Reddit Comments | Commodity Prices |
|---|---|---|---|
| Size | 0.05G | 1.4G | 166KB |
| Columns | 69 | 22 | 15 |
| Rows | 384,972 | 9,993,790 | 1,455 |
| Missing Values | 54,375[delete]; 49,239[removed] | 367,528[delete]; 741,394[removed] | 2,927 |
| Startdate | 2022-01-01 | 2022-01-01 | 2018-01-02 |
| Enddate | 2022-08-31 | 2022-08-31 | 2022-08-31 |
TABLE 2: Basic Information of the Selected Reddit and External Commodity Data. Note:[deleted] is deleted by author; [removed] is removed by moderator.Comments Code and Submissions Code.
Russia-Ukraine Conflict was declared on Feb 24th 2022. We collected reddit and commodity price data before that time in order to compare the trends before and after the event.
| Subreddit | # of Submissions | # of Comments | Active Users | Contains Foreign Langauge |
|---|---|---|---|---|
| CombatFootage | 107 | 270539 | 50383 | 36.45% |
| CredibleDefense | 169 | 64817 | 4828 | 18.34% |
| RussiaUkraineWar2022 | 25513 | 481116 | 48934 | 27.33% |
| UkraineConflict | 13394 | 72528 | 10933 | 29.79% |
| UkraineInvasionVideos | 14360 | 116823 | 16474 | 30.88% |
| UkraineWarReports | 7746 | 78552 | 14175 | 30.03% |
| UkraineWarVideoReport | 45260 | 1724675 | 157469 | 29.08% |
| UkrainianConflict | 86925 | 1987549 | 129635 | 25.03% |
| geopolitics | 60 | 23085 | 5526 | 13.33% |
| ukraina | 17975 | 158422 | 25841 | 50.05% |
| ukraine | 172818 | 4990804 | 262567 | 27.01% |
| war | 645 | 24880 | 7485 | 21.86% |
TABLE 3:Summary Statistics of the Selected Subreddits. Comments Code and Submissions Code.
TABLE 3 shows statistics of each collected subreddit. As shown, some subreddits have many more users and posts than the others. "ukraine", "UkraineWarVideoReport", and "UkrainianConflict" are the top three active subreddits. By using John Snow's language detection model, detect_language_375, we find that there is a significant number of foreign languages in the reddit posts, containing Ukrainian and Russian.

FIGURE 2:Volumes of submissions in English, Ukrainian, and Russian over the observation period.Visualization Code.
The volumes of Reddit submissions in these three languages from selected subreddits changed similarly from January 2022 to August 2022, as shown in FIGURE 2:. The peak for Ukrainian submissions arrived in February, earlier than the other two languages in March. The submission count in English started decreasing ever since, while for Russian and Ukrainian submissions, the number started to rise again around July 2022.
To categorize the submission records by language, we used Spark NLP pre-trained language detection model detect_language_375 and obtained the prediction confidences toward these three languages for each submission content. With the confidence values, we can define dummy variables for three languages by any desired bar. For this plot, the variables are set to be True by confidence over 90%. Please note that since there are posts with prediction confidence lower than 90% for all three designated languages, the total number of submissions in this plot will not add up to the length of our dataset.
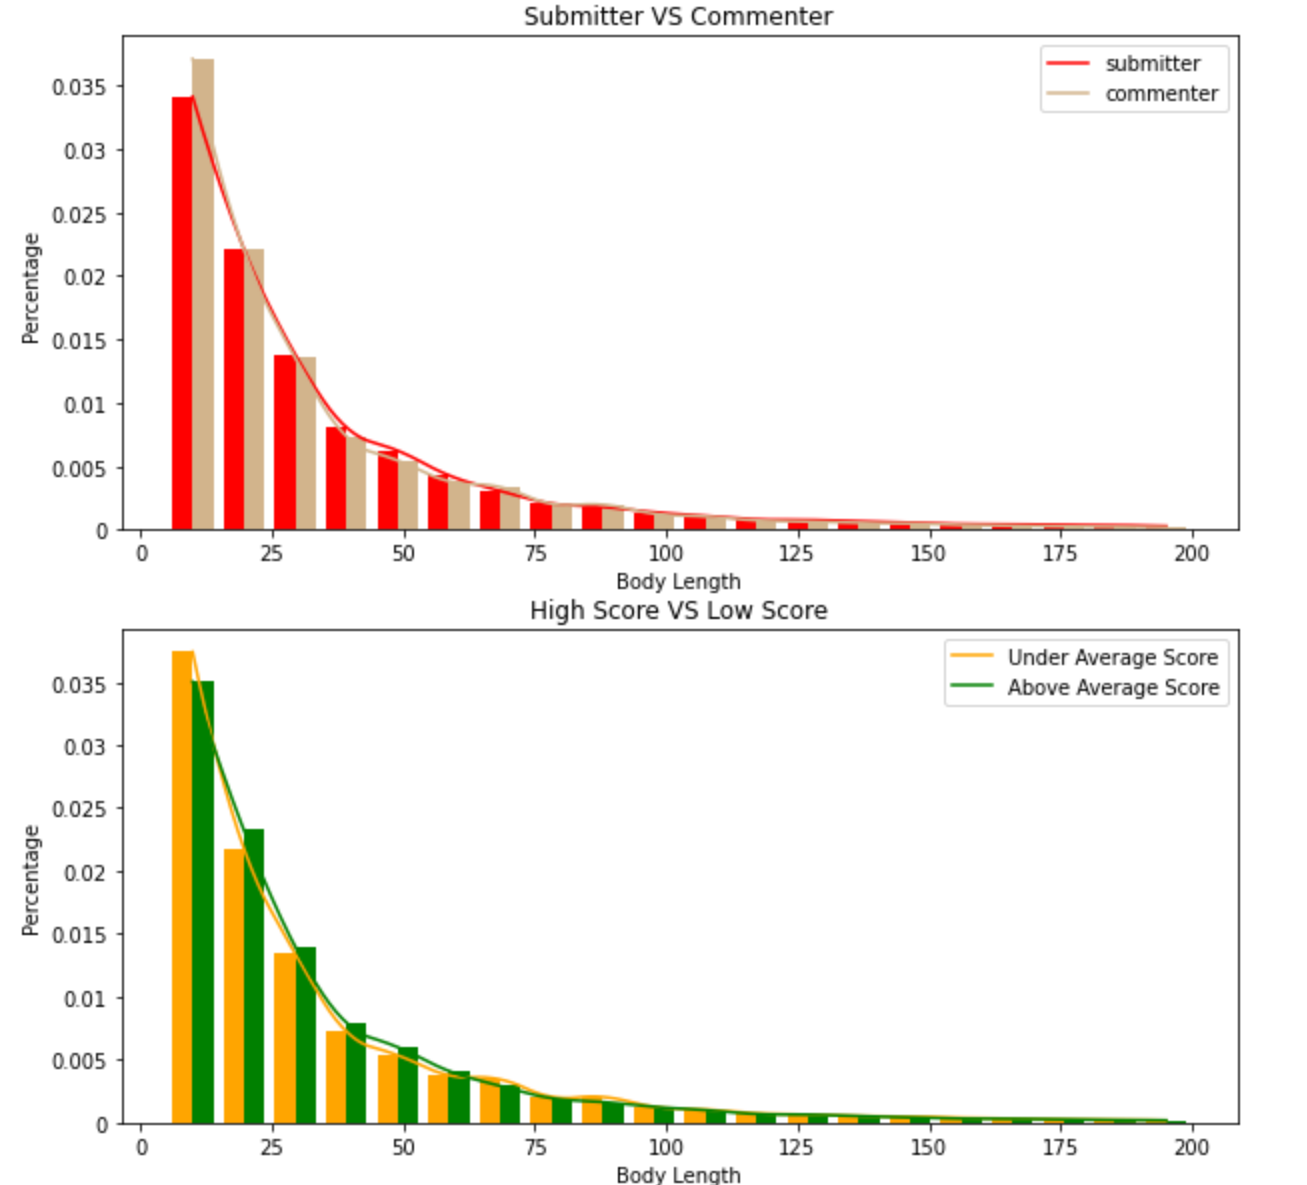
FIGURE 3:Word Count Distribution of Comment Body in Two Categorizations.Visualization Code.
The above charts show the distribution of the number of words. Overall, most comments contain less than 100 words. From the first part, it can be observed that submitters tend to have longer comments than commenters. From the second part, comments above the average score tend to be longer. These findings are intuitively expected.
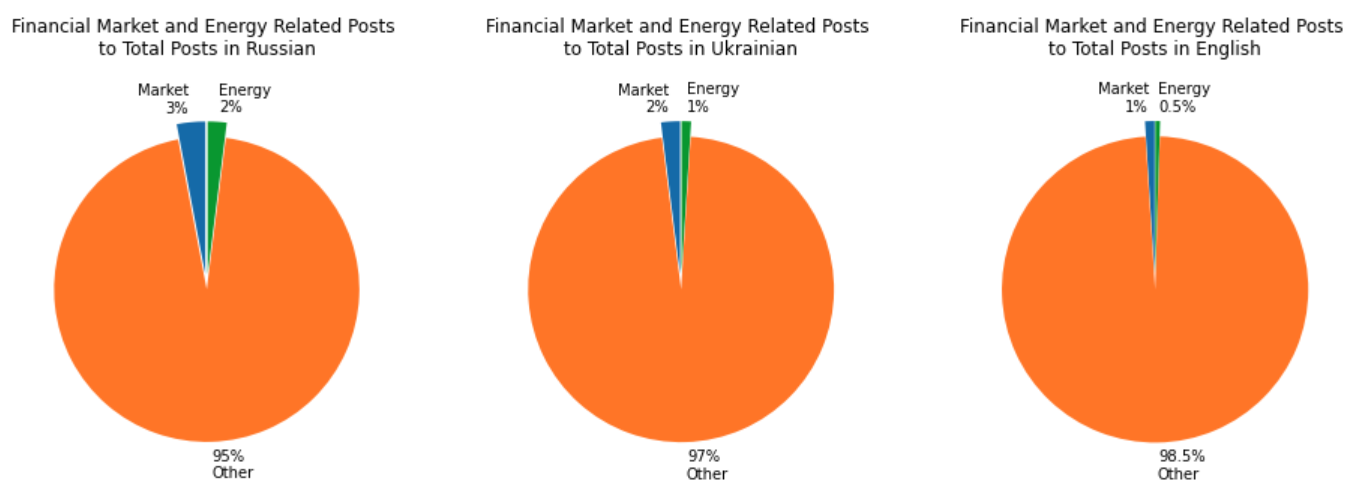
FIGURE 4:Topic distribution for submissions in differnet language.Visualization Code.
For the example topics Market and Energy, they only take a small part in the overall discussions. Nevertheless, these two topics are mentioned more frequently in Russian and Ukrainian posts than in English.
To find the distribution of posts around specific topics, we utilized Spark SQL rlike function and filtered all the posts with keywords like stock/foreign exchange/commodity/trading, energy/crude oil/natural gas in Russian, Ukrainian, and English vocabularies respectively. Later, when we conduct topic modeling, we can also plug keywords and topics detected into the regex filter and create visualizations like this.
Our main goal is to use topics and sentiments in Russia-Ukraine Conflict reddits to explain price movement in the commodity market. Therefore, we collected Commodity Prices from investing.com as our External Data.
| Stats | Observations | Mean | Std | Min | 25% | 50% | 75% | Max |
|---|---|---|---|---|---|---|---|---|
| Barley | 1149 | 1897.88 | 491.47 | 1305.50 | 1518.50 | 1817.50 | 2100.00 | 3261.00 |
| Cocoa | 1178 | 2434.53 | 195.72 | 1895.00 | 2314.00 | 2436.00 | 2552.00 | 3054.00 |
| Coffee | 1177 | 138.38 | 48.13 | 86.65 | 104.10 | 118.20 | 158.70 | 258.35 |
| Corn Futures | 1193 | 459.15 | 133.72 | 302.75 | 362.75 | 387.25 | 557.25 | 818.25 |
| Crude Oil | 1268 | 62.73 | 20.48 | -37.63 | 52.07 | 61.35 | 70.78 | 123.70 |
| Heating Oil | 1263 | 2.06 | 0.76 | 0.61 | 1.70 | 1.98 | 2.19 | 5.14 |
| Natural Gas | 1268 | 3.35 | 1.68 | 1.48 | 2.40 | 2.78 | 3.73 | 9.68 |
| Newcastle Coal | 1191 | 130.71 | 97.25 | 48.50 | 67.85 | 97.15 | 141.58 | 440.00 |
| Oats | 1176 | 371.37 | 151.57 | 220.75 | 273.19 | 300.50 | 403.81 | 807.00 |
| RBOB Gasoline | 1262 | 1.92 | 0.69 | 0.41 | 1.48 | 1.90 | 2.16 | 4.31 |
| Rough Rice | 1177 | 12.99 | 1.94 | 9.78 | 11.70 | 12.56 | 13.74 | 22.07 |
| Soybean Meal Futures | 1184 | 348.65 | 54.63 | 280.00 | 303.77 | 329.40 | 391.65 | 521.90 |
| Soybean Oil Futures | 1200 | 41.72 | 17.05 | 24.99 | 28.59 | 31.70 | 57.95 | 90.60 |
| Sugar #11 | 1181 | 14.53 | 3.04 | 9.21 | 12.15 | 13.36 | 17.66 | 20.42 |
| Wheat | 1191 | 615.65 | 172.68 | 416.50 | 504.25 | 541.00 | 693.00 | 1425.25 |
TABLE 4:Summary Statistics of the External Data Commodity Prices. Note:1.Due to difference in trading rules, commodity futures can have different number of trading days.2.Crude Oil had negative price during Covid when cost of carry exceeded intrinsic value.Visualization Code.
Because it is rare for people to buy commodities at spot price with immediate payment and delivery, we collected futures contract prices, which capture market supply and demand more accurately. Above TABLE 4 shows the summary statistics of 15 kinds of commodities. We choose food and energy commodities because they are more related to normal people's daily lives, thus are more related to Reddit users.
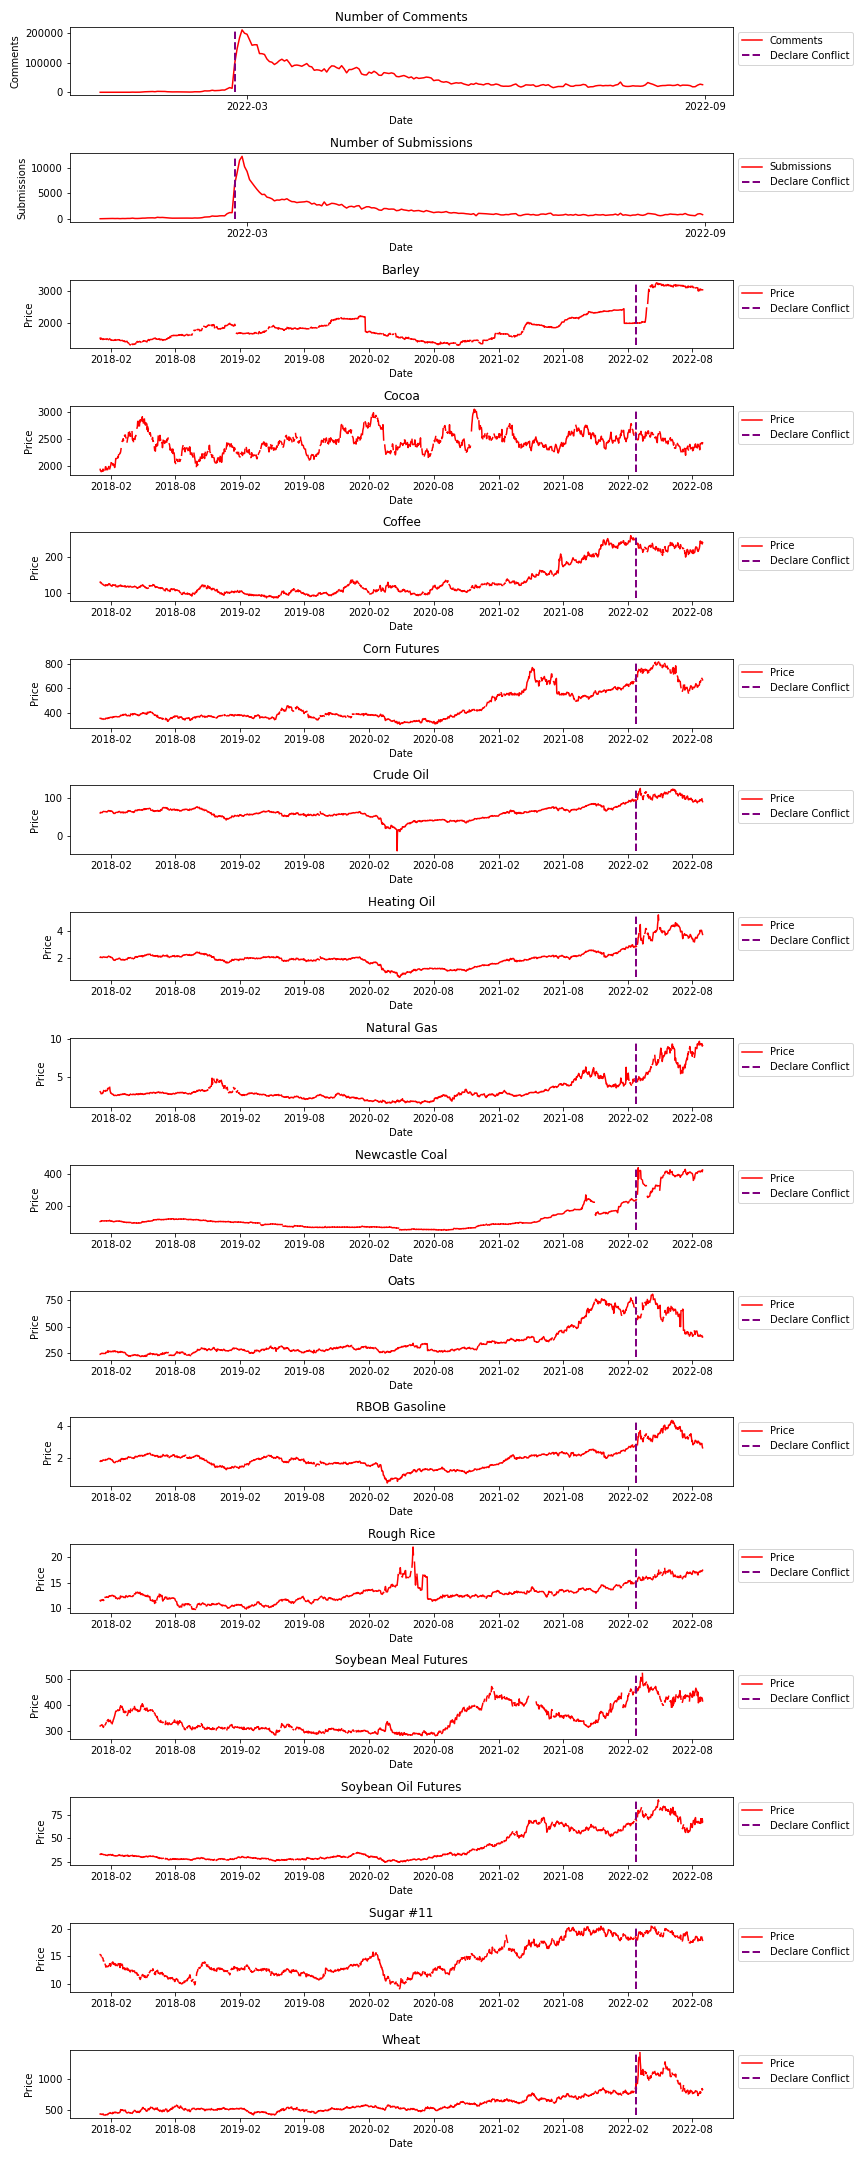
FIGURE 5: Timeseries of Reddit and External Data.Visualization Code.
To study the intertemporal commodity price impact from Reddit, we plotted all the time series together to have a direct observation. As shown from the FIGURE 5, some commodities had a clear uptrend after the conflict declared. "Barley", "Corn", "Crude Oil", "Heating Oil", "Natural Gas", "Newcastle Coal", "RBOb Gasoline", "Soybean Meal", and "Wheat" all had an immediate rise in prices at the end of February. This price movement is in line with our expectation that the conflict has disrupted production and trade of several commodities, particularly those where Russia and Ukraine are key exporters, including energy, and grains.
FIGURE 6: Commodity Price Changes Since Feb 24 2022.Visualization Code.
While many commodities had an impact from the event, some commodity prices recover faster than others like Wheat and Barley. FIGURE 6 shows that Wheat and Barley had 17% and 16% increases in one month. But after 6 months at the end of August, both Wheat and Barley's prices dropped below Feb 24's level. Later in our study, it would be interesting to find out if our Reddit data can explain this price reversion.